

Have you ever been caught sitting through a presentation, eyes glazing over, as slides with slides full of complex data fly across the screen? We’ve all been there.
By the end of Slide 4, you’re struggling to stay interested. This is why data visualization is critical to effective presentation design. By converting raw data into visual stories, you can make your presentations more engaging and more impactful.
In this blog, I’ll break down the basics of data visualization and how to use it to help you create compelling, data-driven presentations.
The Basics of Data Visualization
Most people think of data visualization as simply using charts and graphs. Yes, data visualization is about converting data into visual formats like charts, graphs, and maps but it provides so much more. The truth is, there’s an art to it. It’s about cleaning up your slides and using your data to tell a story. Using too much data, like spreadsheets or numbers, on-screen can distract your audience. They’ll try reading what’s on screen rather than listening to your talking points.
Data visualization eliminates these problems. Instead of presenting rows of numbers, a well-designed bar chart or an interactive chart can immediately highlight significant sales growth. Instead of sending spreadsheets and reports to investors, you may choose to send a presentation to show only the most important data visually. Showing data through visuals makes your point clear, memorable, and quick to digest. You can see the difference too. Just look at any presentation by Tim Cook (Apple), Marc Benioff (Salesforce), or Google’s Sundar Pichai. They all adopted data visualization, and when they present – people listen.
Choosing the Right Visualization
Using the right visualization is important to effectively communicate your message in a presentation. The type of visualization you use depends on the data, your audience, and the presentation’s purpose. For example, stakeholder presentations and pitch decks often need detailed statistics and precise data representations, while all-hands meetings benefit from simpler, more engaging visuals. That’s because detailed charts help stakeholders and investors make data-driven decisions by showing comparisons, trends, and forecasts clearly. In contrast, all-hands meetings need to review a lot of information quickly. Using pie charts and infographics makes data easy to understand and visually engaging. (And gets you out of the meeting faster.
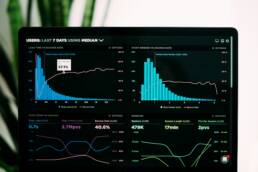
Data visualizations like charts and gauges tell a clear story that helps you go beyond raw data, website performance in this case.
Understanding Data Types
The first step to storytelling with data is to understand the types of data you’ll use. Knowing that will help you choose the right visualization for your presentation. Here’s a breakdown of common data types and how they can be effectively visualized:
- Quantitative Data: Quantitative data is any data that can be measured or counted, such as sales numbers, temperatures, or age. It’s often visualized with bar charts, line graphs, and histograms.
- Qualitative Data: Qualitative data refers to non-numerical data that describes qualities or characteristics, such as survey responses or categories of products. Pie charts, donut charts, and stacked bar charts are commonly used for this type of data.
- Temporal Data: Data that involves time elements (e.g., dates, hours, and years) is best visualized through timelines or line graphs to show trends over time.
- Geographical Data: When data is tied to specific locations, geographic maps or heat maps are ideal for showcasing spatial relationships and distribution.
Choosing Visualization Based on Objectives
Different visualizations serve different purposes. You’ll want to know what your objective is before picking a visualization type. What story are you trying to tell? If your goal is to compare sets of values, bar charts, stacked bar charts, or scatter plots are effective. These highlight differences and similarities clearly. To show data distribution, histograms, and box plots are better as they help visualize the range and common values within your dataset. When illustrating how different parts make up a whole, pie charts or stacked area charts provide a clear view of each component’s contribution. To show the relationship between variables, scatter plots or bubble charts are great tools.
Not all data visualizations need to be a chart. This map tells a specific story about the spread of the COVID-19 disease.

Examples of Effective Visualizations
It’s ok if choosing which type of visual to use is confusing. Presentation designers spend years perfecting the best visuals and tweaks to make data pop. To help you, let’s go over some real-world scenarios explaining which type of visual to use. We’ll start with my most requested presentation type: sales decks.
01. Showing Sales Performance:
Imagine you’re getting ready to present the sales performance over the past year. You want to condense the data into a visual. A line graph can clearly show monthly sales trends, helping to identify peak seasons or periods of low sales. This visualization makes it easier to strategize future sales tactics.
02. Presenting Customer Feedback:
For customer feedback, a pie chart displaying categories of feedback (Positive, Neutral, Negative) quickly communicates the proportion of each category. Doing this makes it easy to understand overall customer sentiment. The faster you have this insight, the faster you can make critical decisions.
03. Market Analysis Presentations:
Market analysis presentations often use a variety of visualization types. However, a standard I go back to time and time again is a heat map. Heat maps can show product popularity across different regions and can reveal where to concentrate marketing efforts. This allows you to create more targeted and effective marketing campaigns.
Tips for Effective Visualization
Creating effective data visualizations can take time to master, but there are a few tips I can give. First, keep things simple and avoid clutter. You must focus on the core message you want to convey. When it comes to colors, pick ones that are easily distinguishable. Keep in mind you may have audience members with color blindness, so make sure your colors can be seen by anyone. Consistency is also important. Use the same scales and axes across multiple charts to make comparisons straightforward. With practice, you’ll be able to enhance your presentations and captivate your audience.
Great Data Tells A Story
Data visualization is a powerful tool to make presentations more engaging and effective. By understanding data types and selecting the appropriate visualizations, you can use complex data to tell stories that influence your audience.
If you’re looking to elevate your presentations with better data visualization, I’m here to help. Get in touch to learn more about how we can support your data storytelling efforts.
Related Posts

Crafting the Future: OpenAI’s Strategic Narrative
Explore OpenAI's strategic narrative and discover how storytelling shapes its…

Unpacking Shopify’s Strategic Narrative: Rewriting the Rules of eCommerce
Explore how Shopify transformed from a snowboard shop to a global commerce…

Canva’s Strategic Narrative: How Design Democratization Created a $40 Billion Empire
Discover how Canva's strategic narrative empowers creativity through…

Nintendo’s Strategic Narrative: A Masterclass in Storytelling
In the ever-evolving landscape of the gaming industry, Nintendo stands as a…